
What is Driving Inflation?
What is Driving Inflation?
High Economic Inflation in Consumer Pricing
Written by: Steven Lesser, FCAS, MAAA
The insurance industry has been grappling with social inflation for years. More recently, the pandemic disruption has reshaped everything from driving patterns to the structural aspects of the economy, and has motivated changes to consumer behaviors, such as how people report and settle claims.
Now, the industry has to deal with accelerating economic inflation. Prolonged high economic inflation could increase the risks of material insurance pricing errors and reserve deficiencies, as the true costs of settling claims might greatly outpace the cost assumptions built into the projections for insurance rates and reserves.
Economic inflation is often measured by the Consumer Price Index (“CPI”). The CPI captures the prices paid by consumers for a “market basket“ of goods and services. Tracking the CPI over time yields an estimate of economic inflation. There are many CPIs, but one that is frequently cited is the “CPI-U,” which captures the prices paid by urban consumers. The CPI-U includes expenditures by urban wage earners and clerical workers, professional, managerial, and technical workers, the self-employed, short-term workers, the unemployed, retirees and others not in the labor force. Another index, the CPI-W, includes only expenditures by those in hourly wage earning or clerical jobs.
Over the 12-month period ending June 2022, the CPI-U increased 9.1 percent before seasonal adjustment. This 9.1 percent increase was the largest annual increase since the 12-month period ending November 1981. Figure 1 shows the annual change in the CPI-U index over a twenty-year period.
Figure 1

The 9.1 percent CPI-U increase was broad-based, with the component indices for gasoline, shelter, and food being the largest contributors to the overall change. The all items less food and energy index rose 5.9 percent over the last 12 months. The energy component tends to be highly volatile; for that reason, it is common to look at the CPI change excluding that component. Figure 2 shows how various items have contributed differently to the overall CPI-U index.
Figure 2
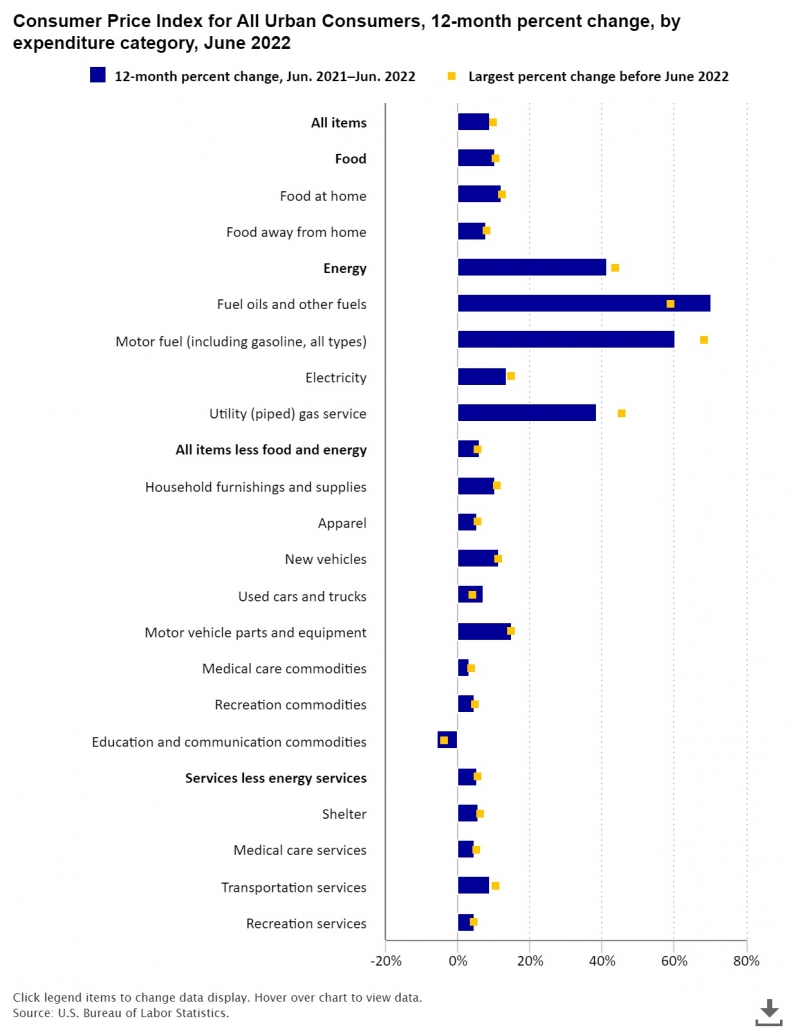

The energy index rose 41.6 percent over the last year, the largest 12-month increase since the period ending April 1980. Within the energy category, motor fuel prices (which includes all types of fuels, including gasoline) increased 60.2 percent over the year. Gasoline prices increased 59.9 percent, the largest 12-month increase since March 1980. Electricity prices rose 13.7 percent, the largest 12-month increase since April 2006. Natural gas (piped utility gas) prices increased 38.4 percent over the 12-months ended June 2022, the largest increase since October 2005.
The food index increased 10.4 percent for the 12-months ending June, the largest annual increase since the period ending February 1981. Prices for food at home rose 12.2 percent over the last 12 months, the largest increase since April 1979. Prices for food away from home rose 7.7 percent, the largest 12-month change since November 1981.
Prices for new vehicles increased 11.4 percent over the year. Prices for used cars and trucks, a close substitute for new vehicles, were up 7.1 percent, while prices for motor vehicle parts and equipment increased 14.9 percent.
How long will this level of inflation last and what, if any, will be the lasting impact on claim costs? While inflation assumptions used in insurance pricing and reserving analyses often reflect long-term time horizons, insurance professionals should review these assumptions to make sure they are reflective of the changing environment.
Questions or concerns regarding Inflation? Contact a Huggins Actuary for assistance.
Source: https://www.bls.gov/


