Measuring Climate Change
Climate Change is a Relative Concept – Why We Should Pay Attention to the Actuaries Climate Index (ACI)
Measuring Climate Change
Headlines from a News Release on August 1, 2018 by US and Canadian Actuarial Organizations:
Fall 2017 Data Reveal Extreme Weather Frequency and Sea Level Changes Continue to Drive Composite Index Values Higher
Hurricane Harvey caused $125B of damage and has barely receded in our memories. Hurricane Florence has devastated the Carolinas coast line and the damage caused by flooding continues to unfold. These painful reminders of the havoc we are experiencing because of hurricane-related activity provide an apt moment to reflect on the topic of climate change.
Frame of Reference
Modern infrastructure is built to operate in a narrow band of physical parameters. Along the coastline and rivers, homes are built at a certain distance from the water based on historically observed levels of water. House roofs and siding are built to withstand a certain range of wind speeds. When the physical environment surrounding properties changes such that it is outside of the range of tolerance, damage and devastation occurs. As we are observing for Hurricane Florence, large scale evacuations and costly rescues need to take place. Hence, we are concerned with climate change and, much more importantly, concerned with the rate of climate change.
Actuaries Climate Index (ACI)
Based on the above, the ability to measure changes in climate objectively is critical to US and global population. Although this appears to be a seemingly simple and important objective, it is fraught with controversy since it has such broad and dramatic ramifications.
To minimize controversy and maintain objectivity and without dwelling into the causes and the solutions to the issue, actuarial organization in the US and Canada have formulated the quarterly Actuaries Climate Index TM (ACI) as an objective measure of changes in extreme weather and changes in sea level relative to the base period of 1961 through 1990. The Index is an educational tool designed to help inform actuaries, public policymakers, and the public on changes in these measures over recent decades.
The Actuarial Climate Index consists of six components:
- Changes in the frequency and duration of extreme high temperatures;
- Changes in frequency and duration of extreme low temperatures;
- Heavy precipitation;
- Drought;
- Strong wind; and,
- Changes in sea level.
These six components for the Actuaries Climate Index were selected since they are representative of the key impacts of climate on people and the economy. The Index is available for 12 regions in the United States and Canada and examines how the six components, and the composite thereof, are changing over time by region and across the two countries.
The ACI is an index of climate risks not unlike the Consumer Price Index that monitors average price changes over time to a basket of standard goods and services. Actuaries measure and manage many types of risks; changes in climate is one of them. Increasing values in the index point to increased occurrences of extreme climate events.
The graph below shows the ACI value from the reference period of 1961 to 1990 to more recent decades. The key metric is the five-year moving average shown by the black line. Starting with a reference period, from which the index was set at zero, the ACI has risen steadily.
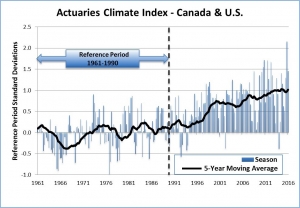
With the Fall 2017 data, the five-year moving average of Actuaries Climate Index reached 1.19, a new record that surpasses the previous record of 1.14. The seasonal Actuaries Climate Index value increased to 2.00, from a previous level of 1.59.
In simple terms, continued deviation of temperature and sea level extremes from historically expected patterns continue to push the indices upward. This is challenging news to the entire man-made and natural ecosystems.
Significance of Relative Change
Relative change and the pace of change in climate is of significance to the entire ecosystem but of most importance to modern man for several reasons.
- Within the past century, in the developed countries, we have been dramatically successful in engineering the physical environment to suit our needs. For example, we have constructed homes and offices so that we can live and work in a narrow temperature band of 65-75 degrees F. We have built roads, railways, and air transport networks that allow us to travel thousands of miles away. We have created electrical grids to bring us power exactly where we need it.
Although a marvel of modern engineering, our man-made environment is susceptible to damage from climate change. More importantly, we have become dependent on this infrastructure and have reduced the capacity to adapt to changes in the physical environment. Ironically, to make the physical environment suit our needs, we have magnified our susceptibility to climate change dramatically. Any adaptation to climate change now involves maintaining the fragile man-made environment.
- Although not obvious to us daily, we are very dependent on the rest of the ecosystem to maintain our comfortable modern lifestyles. We may be able to take care of additional rainfall through extra drainage, but it has a significant impact on the crops that are grown in our area. Due to our dependence on agriculture and the specific types of crops we produce, we cannot just stop at taking care of extra rainfall for ourselves and ignore its impact the ecosystem we have created to suit our needs.
- We now live in a globally interdependent world, economically and physically. Hence, the impact of relative climate change is never confined to one geographic area.
Further Background on the ACI
To explore the index, select Regional Graphs, Component Graphs, or Maps, please visit the website of the American Academy of Actuaries and click on the icon for ACI. You can use the EXPLORE menu to go directly to the screen showing aggregate index values for the US and Canada and look at continental USA or Canada, or if you prefer, at one of the 12 regions of interest to you.
The data used for the ACI is gathered from the following public data sources:
Drought, Temperature, & Precipitation
- Global Historical Climatology Network (GHCN) Daily, from the NOAA Satellite and Information Service, is an integrated database of daily climate summaries from land surface stations across the globe. The grids each cover a surface area of 2.5 degrees longitude by 2.5 degrees latitude.
- GHCNDEXis a dataset based on GHCN Daily. It provides gridded, station-based indices of temperature-and precipitation-related climate extremes and was developed by the Climate Change Research Centre and the Australian Research Council’s Centre of Excellence for Climate System Science.
- CLIMDEX(Datasets for Indices of Extreme Weather) is developed and maintained by researchers at the Climate Change Research Centre (CCRC), The University of New South Wales (UNSW), and funded by the Australian Research Council and the Australian Department of Climate Change and Energy Efficiency through Linkage project LP100200690 and in collaboration with the University of Melbourne, Climate Research Division (Environment Canada) and NOAA’s National Climatic Data Center (USA). See also: Expert Team on Climate Change Detection and Indices at the World Meteorological Organization.
Sea Level
- Obtaining Tide Gauge Datafrom the Permanent Service for Mean Sea Level, which is based in Liverpool, UK, at the National Oceanography Centre (NOC), and is a component of the UK Natural Environment Research Council (NERC).
Wind
- The National Centers for Environmental Prediction(NCEP) reanalysis data, done in conjunction with the National Center for Atmospheric Research (NCAR), is provided by the National Oceanic and Atmospheric Administration’s Oceanic and Atmospheric Research/Earth System Research Laboratory Physical Sciences Division in Boulder, Colorado, USA.
Please contact the authors for more information:
Chandu C. Patel, FCAS, MAAA E-mail: chandu.patel@hugginsactuarial.com
Kim Piersol, FCAS, MAAA Email: kim.piersol@hugginsactuarial.com
Ronald T. Kuehn FCAS, MAAA, CERA, CPCU, ARM, FCA Email: rusty.kuehn@hugginsactuarial.com